
06
Infographic Booklet
Role: Design Student
Background: This project was completed during my second-year of design school.
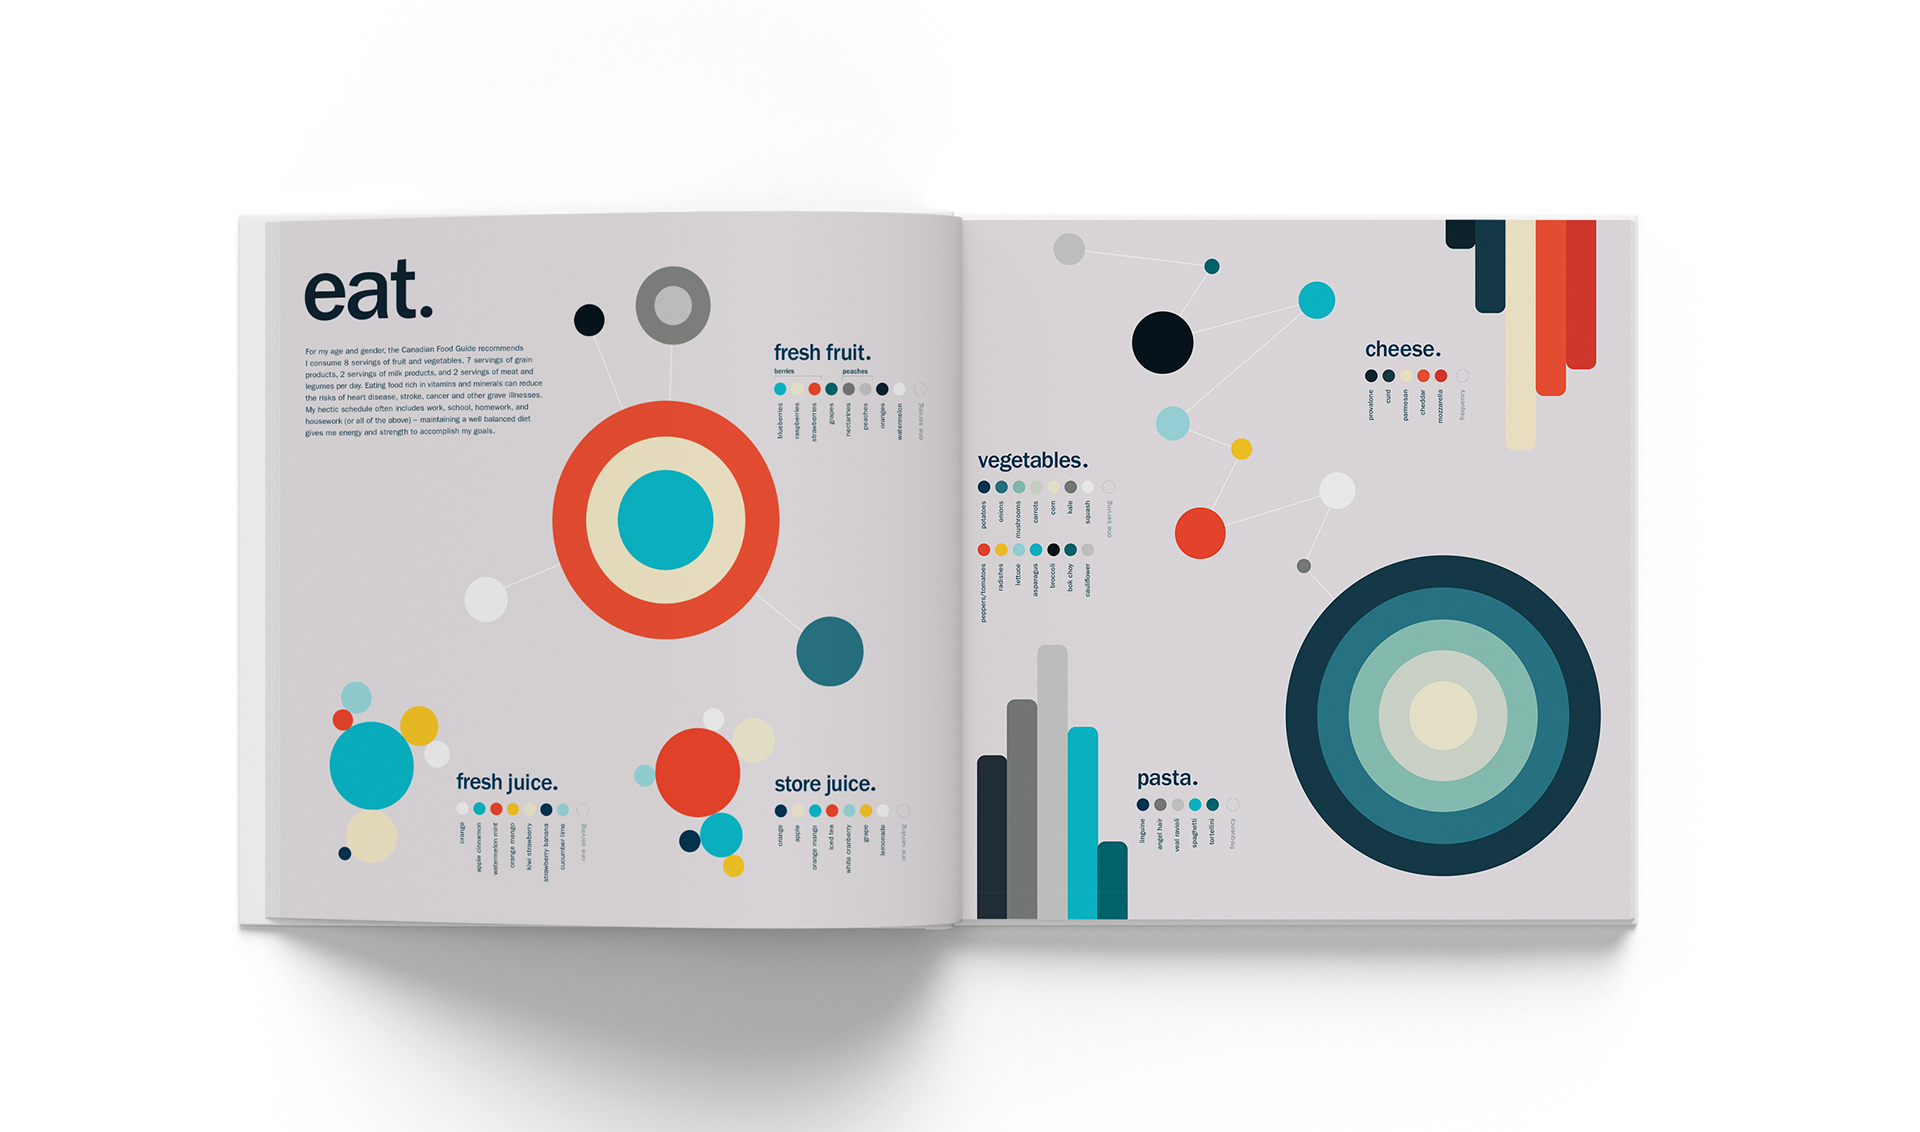
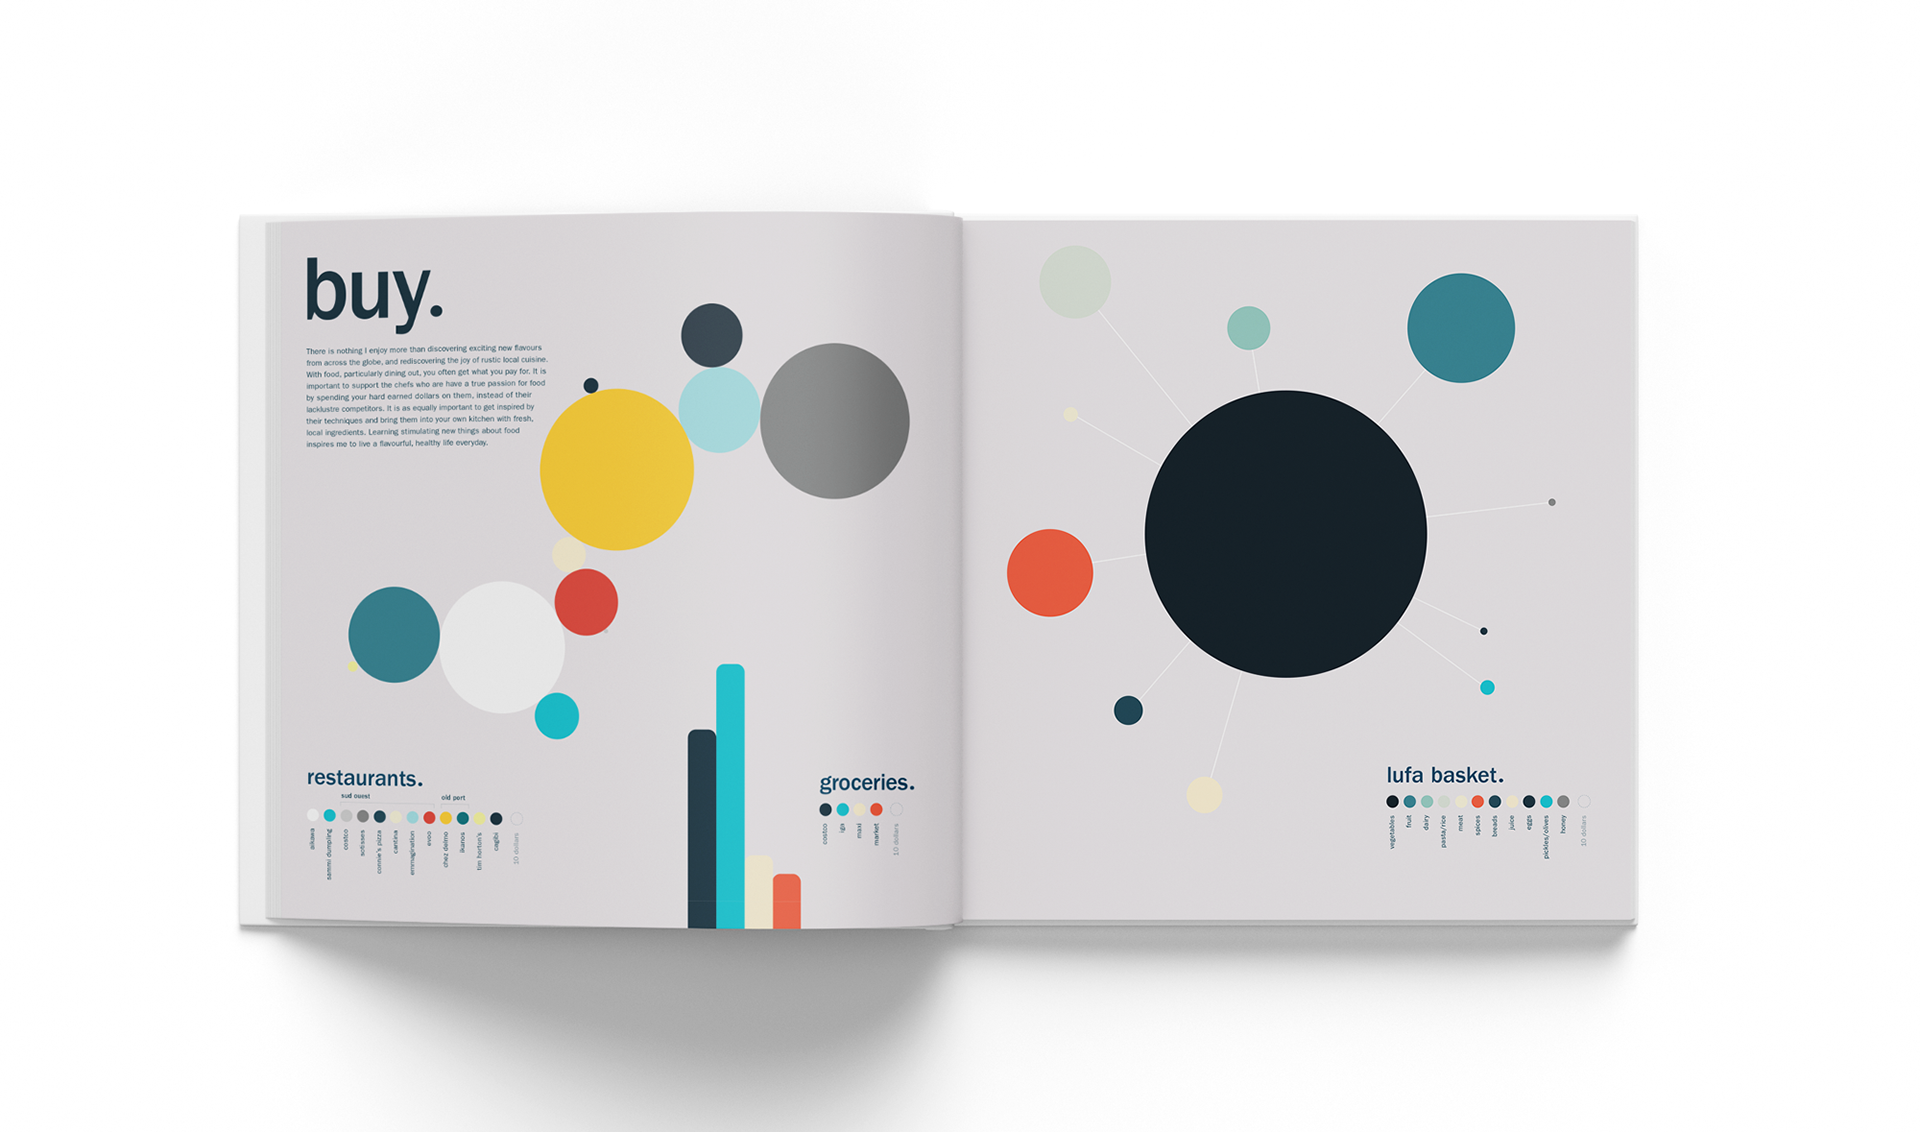
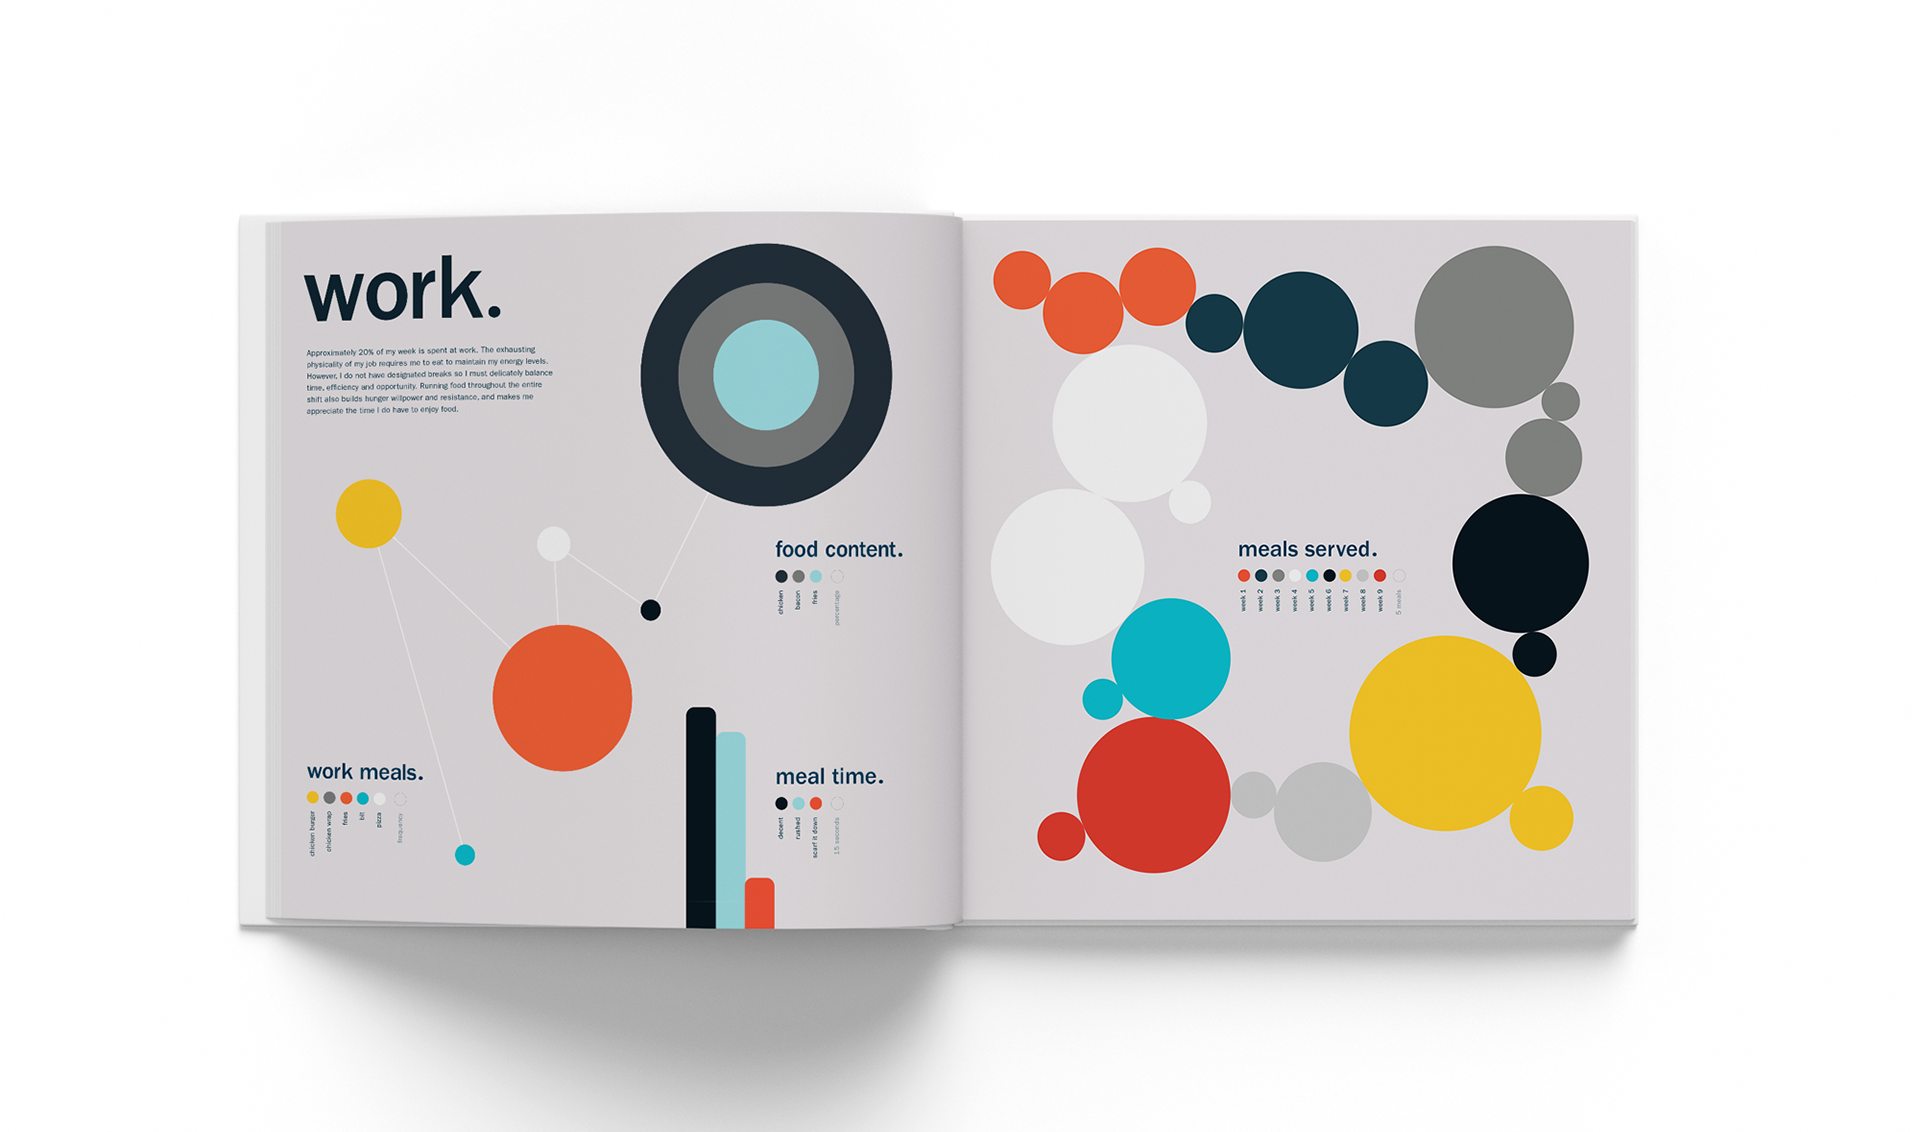
Brief: For nine weeks, we had to write down everything we did in our lives, from eating to sleeping to working and everything in between. At the end of the nine weeks, we had to choose a theme from the data and create a compelling infographic booklet.
Process: I tore out the pages of my data-capturing journal and spread them across the floor to see what patterns stood out. As I am an avid foodie and was working in the restaurant industry at the time, food was a big part of my life and my data. I took time brainstorming, researching inspiring data visualizations, experimenting with shapes, graph styles, typography, and colour. I landed on circles as a conceptual expression of the organic nature of food and chose colours found in my weekly grocery order.
Results: Well received by professors and classmates. It was chosen by the graduate committee to display on my vernissage table at graduation.
Learnings:
• It was my first real encounter with data and taught me a lot about collecting data, data integrity, and data visualization
• I tested out different print techniques, including DIY, local, and online vendors and discovered differences in the quality and finish available for printed material
• It was my first real encounter with data and taught me a lot about collecting data, data integrity, and data visualization
• I tested out different print techniques, including DIY, local, and online vendors and discovered differences in the quality and finish available for printed material
Design: Cassy Trussell